How Jefit Measures and Guides Your Real Progress
Building strength isn’t just about lifting heavier — it’s about understanding how your body adapts across every movement pattern.
The Strength Engine (powered by Jefit’s Load Progression model) is part of Jefit’s Progressive Overload (PO) System and the foundation of your NSPI dashboard.
It helps you see how your strength is changing — pattern by pattern, week by week — and how those shifts feed into your long-term progress.
Table of contents
What the Strength Metric Represents
How the Strength Graph Differs from the NSPI Graph
How the Strength Engine Works
How to Read Your Strength Bars
Personalized by Goal and Experience
Why It Matters
What’s Next
Explore More
North Star Progress Index Overview →
Stimulus Engine →
Movement Balance Engine →
In Short
What the Strength Metric Represents
The Strength section measures how your performance is evolving across six fundamental movement patterns:
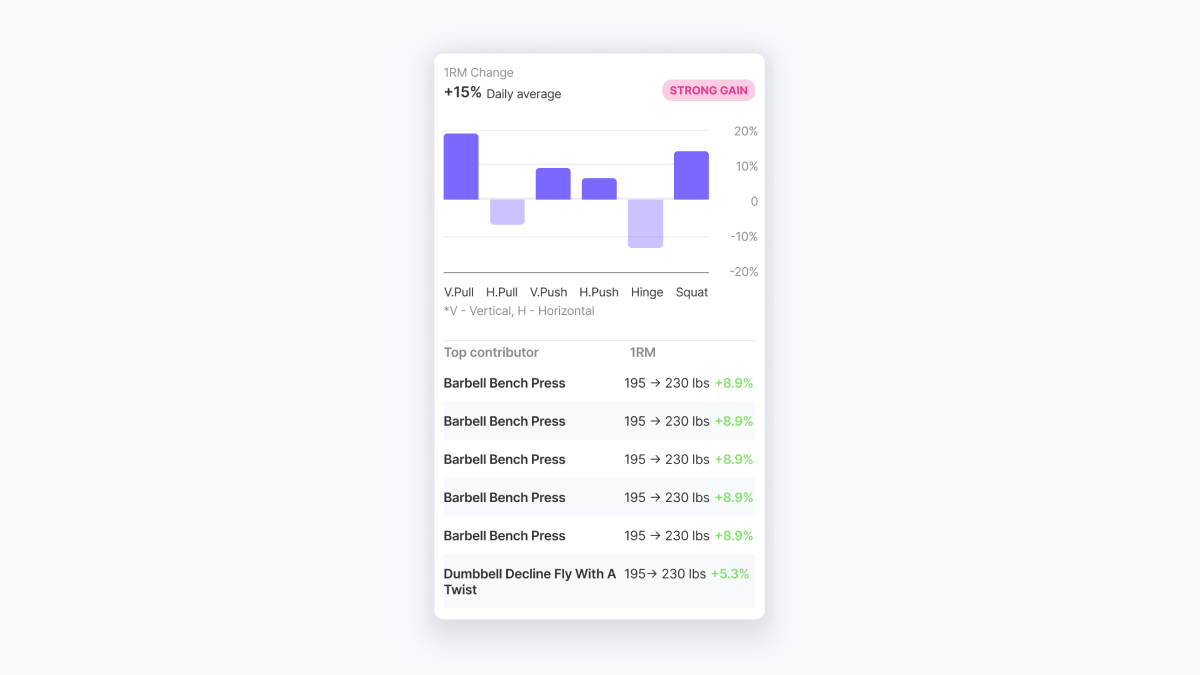
- Vertical Push (e.g., Overhead Press)
- Vertical Pull (e.g., Pull-Up, Lat Pulldown)
- Horizontal Push (e.g., Bench Press, Push-Up)
- Horizontal Pull (e.g., Row variations)
- Hinge (e.g., Deadlift, Hip Thrust)
- Squat (e.g., Back Squat, Leg Press)
Each bar you see on the dashboard represents your week-to-date delta — the average change in your top-set performance for that movement pattern compared to your recent baseline.
If the bar is above 0, that pattern is trending stronger this week.
If it’s below 0, that pattern is showing temporary regression — often due to fatigue, recovery gaps, or reduced training exposure in that pattern.
Together, these six bars give you a quick diagnostic snapshot of where your current training stress and adaptation are happening.
How the Strength Graph Differs from the NSPI Graph
Your NSPI graph shows a normalized overall progress curve — how your full training system (Strength + Stimulus Volume + Movement Balance) tracks against its planned trajectory.
The Strength graph, by contrast, is short-term and pattern-specific.
It isn’t a historical trend line — it’s a week-to-date readout that refreshes as you train.
Think of it as a dashboard of “micro-adaptations”: which movement patterns are currently improving faster, holding steady, or lagging slightly.
Those pattern deltas collectively feed into your overall NSPI Strength trend — the long-term signal you see reflected in your NSPI graph.
How the Strength Engine Works
Behind those six bars is an adaptive model that reads your real workout data to detect meaningful change:
- Top-Set Detection
The system identifies your most credible working sets each session — the ones heavy enough to represent real performance. - Session-to-Session Comparison
Each new top set is compared to your recent pattern baseline to compute the delta (% change). - Goal & Experience Adjustment
The expected “neutral” zone differs depending on your goal (strength, hypertrophy, cutting, power, etc.) and experience level.
Beginners might see larger positive bars; advanced users’ bars move more subtly. - Normalization for Consistency
Large one-off lifts don’t distort your data — the system smooths noisy sessions to keep the bars reflective of consistent trends. - Aggregation into NSPI
These six deltas are then weighted and aggregated into the Strength component of your overall NSPI score.
So what you see in the Strength section is the raw, per-pattern signal, and what you see in the NSPI graph is the processed, normalized outcome over time.
How to Read Your Strength Bars
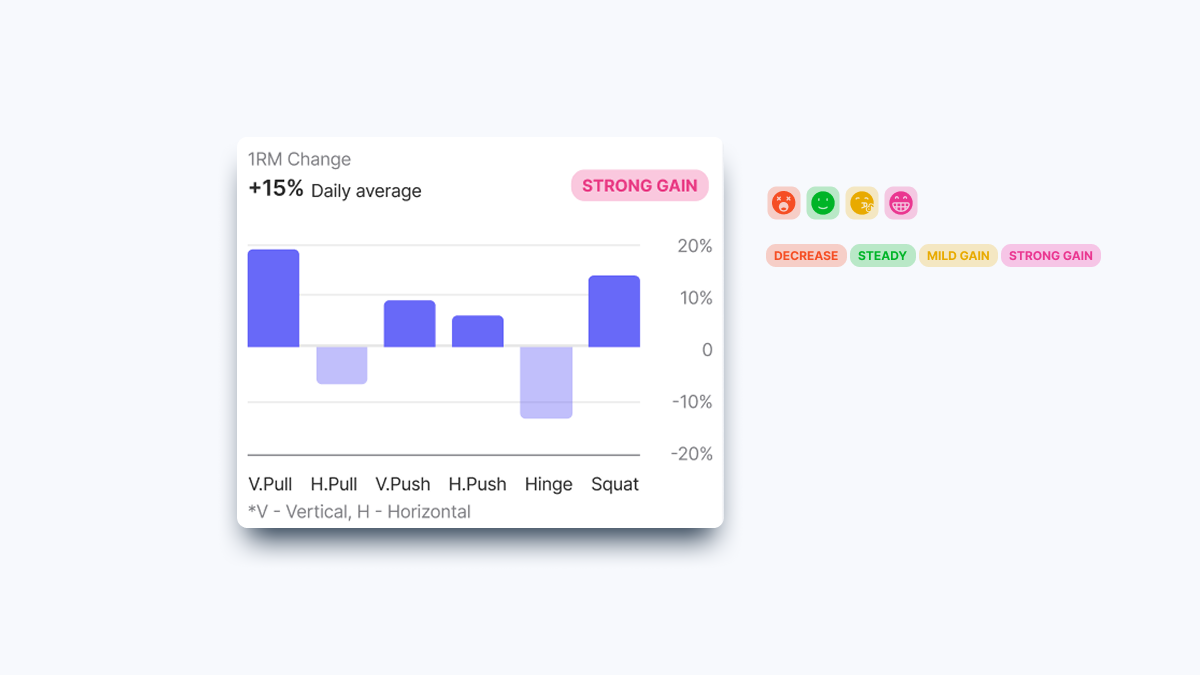
- Bars Above 0 → Positive Trend
That pattern’s performance is improving this week.
Occasional high bars mean great adaptation.
If all six bars are high, it’s been a strong training week — just ensure recovery matches intensity. - Bars Near 0 → Stable Performance
You’re maintaining strength while managing fatigue — ideal during high-volume or maintenance phases. - Bars Below 0 → Temporary Regression
Slight dips often reflect fatigue or lower exposure to that pattern.
Rebalance, rest, or refine intensity to bring it back up.
💡 Tip: A mix of positive and negative bars is normal — strength adaptation isn’t linear.
The goal is steady long-term improvement across all patterns, not perfect bars every week.
Personalized by Goal and Experience
Your Strength section adapts dynamically to your goal and level:
- Strength Goal: Bars reflect heavier top sets with smaller deltas; focus on load quality.
- Hypertrophy Goal: Bars respond more to consistent working intensity across sessions.
- Cutting / Maintenance: Bars stabilize near 0 — preserving strength under reduced energy.
The size of your weekly bars and your NSPI Strength trend both evolve as the system learns from your ongoing training data.
Why It Matters
Strength gains aren’t uniform.
Some movement patterns adapt faster, others slower — and that’s exactly what the Strength section reveals.
By visualizing your six-pattern deltas, you can spot where progress is leading and where recovery might be due.
Over time, those weekly signals feed into your broader NSPI Strength trend, confirming that your full training system is improving efficiently.
What’s Next
Soon, these pattern-level deltas will also feed directly into mesocycle adaptation, allowing Jefit to automatically pace intensification or deload phases per movement group — ensuring balanced development and recovery.
It’s one more step toward an AI-driven system that trains with your body’s feedback in real time.
Explore More
Explore the rest of the NSPI System:
In Short
The Strength Engine tracks how your performance is shifting across six key movement patterns each week — giving you actionable, pattern-level insight into your progress.
Those small week-to-date changes feed into your long-term NSPI Strength trend, helping Jefit adapt your training intelligently.
Because strength isn’t about one lift — it’s about every pattern moving forward, together.
- Adaptive Mesocycle Training: JEFIT’s Smarter Way to Progress - April 15, 2026
- The Science Behind Jefit’s Load Progression Engine - November 20, 2025
- The Stimulus Volume Engine - November 19, 2025